AeroContour
A data visualisation and
processing tool for aerodynamic ride height data
You can use AeroContour to view and modify ride height aerodynamic
data from the wind tunnel. With it you can compare multi-ride height aero maps,
create extended and evenly gridded maps from limited areas and sparse and
irregular grids (e.g. for use in modelling tools or spreadsheet look up tables)
and extract real aero characteristics from aero maps.
AeroContour has been developed explicitly for motorsport use and is in
service with professional aerodynamicists and race engineers in many teams and
constructors.
Major features
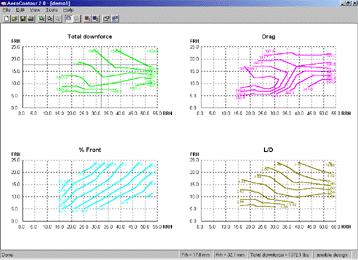
 Generate contour plots instantly
- AeroContour
will generate a complete set of formatted contour plots (Total, Front
and Rear Lift, Drag, % Front, L/D, Rear L/D) just by pasting in or
entering the basic aero data (ride height, lift, drag and balance).
- Unlike many generic contour plotting
programs AeroContour will handle sparse irregular sets of ride
height measurement points, typical of most wind tunnel sets.
- Ride height points are triangulated
using natural neighbour proximal order for optimal and unique
gridding.
- Spot value readings from any part of a
contour plot can be taken with a cross hair cursor, returning
bi-linearly interpolated values.
- Contour plots can be viewed as one or
four to a screen.
|
 Slice a contour plot with a ride
height history
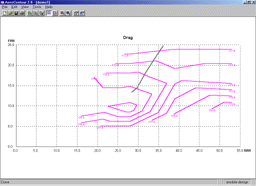
- An important and unique feature: actual
ride height histories, from simulations or data acquisition, can be
imported from external files and overlaid on any contour plot.
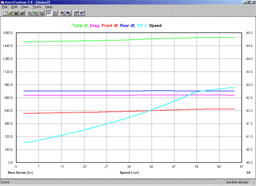
- A special plot can then be generated
showing the principal aerodynamic values varying through the ride
height history.
- With this feature you can compare
different datasets using actual ride heights characteristic of the car
you are developing. The result is a continuous curve which contains
far more information than the usual two or three typical ride height
points that are used.
- It is the best way to get a truly
objective measure of the performance of a particular dataset and
provides information for vital for car set up.
|
|
 |
 |
 Extend and resample ride height
maps
- Ride height maps can be easily extended,
and the original data re-sampled to create a fully populated, regular
rectangular ride height map.
- This is essential for use in other
programs such as lap simulations.
- Much quicker and more accurate than
manual resampling and more convenient than testing the model at every
point.
|
 Compare datasets visually
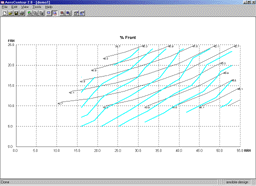
- Two datasets can be loaded at any time,
and you can switch views between them.
- One dataset can be overlaid on the other
with automatic formatting of the bottom set to allow intelligent
comparisons.
- A dataset that represents the difference
between the two can be instantly generated and viewed, again with
automatically applied formatting.
|
 |
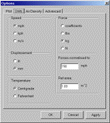
 Change units, find forces at
different speeds, account for atmospheric effects
- Unlike a generic data visualisation
program AeroContour understands the nature of aerodynamic data
so the display units can be freely chosen from coefficients or
absolute or normalised force values with any speed.
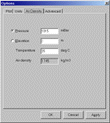
- Atmospheric effects on air density, and
consequently forces, can be accounted for by entering different
ambient temperatures and altitude or barometric pressure. This makes
it easy for you to predict downforce and drag levels under different
conditions.
- The original data is always preserved.
|
 |
 |
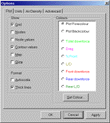
 Format and print plots
- There are many plot area formatting
options, for example autoscaling, toggling of node points and values,
line colours, contour values.
- Data sets can be saved and restored with
complete formatting information.
- Plots and printouts are scaled equally
on X and Y axes, a feature often missing on generic plotters.
- High-resolution prints can be made of
any plot, or of a complete set of plots.
- Plots can be copied automatically to the
Windows Clipboard for pasting into other programs, for example reports
in MS Word or Excel.
|
 |
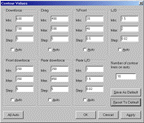
 Set contour levels manually or
automatically
- Contour levels can be set
automatically, for greatest ease of use,
- Contour levels can also be precisely
manually formatted which is vital when comparing data sets.
- You can save a default set of
contours, to establish a constant baseline.
|
 |
 Get productive quickly
- The straightforward interface provides
only the tools required for the job of plotting aero data, unlike
generic data visualisation tools which are often cluttered with
irrelevant commands and controls, making AeroContour easy to
pick up and use quickly.
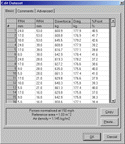
- Data can be manually entered or edited
using a built in grid, or pasted in directly from a spreadsheet.
- The program comes with a comprehensive
illustrated user manual.
|
 |
|
| |
AeroContour can produce
resampled aero data files from spares irregular data in the
correct format to be used by directly AeroLap.
|
| |
| AeroContour v3 is due for release
sometime in Q1 2008. This will be
our first product written in VB.NET and will run on Microsoft
Windows Vista®
and XP®. |
|
