|
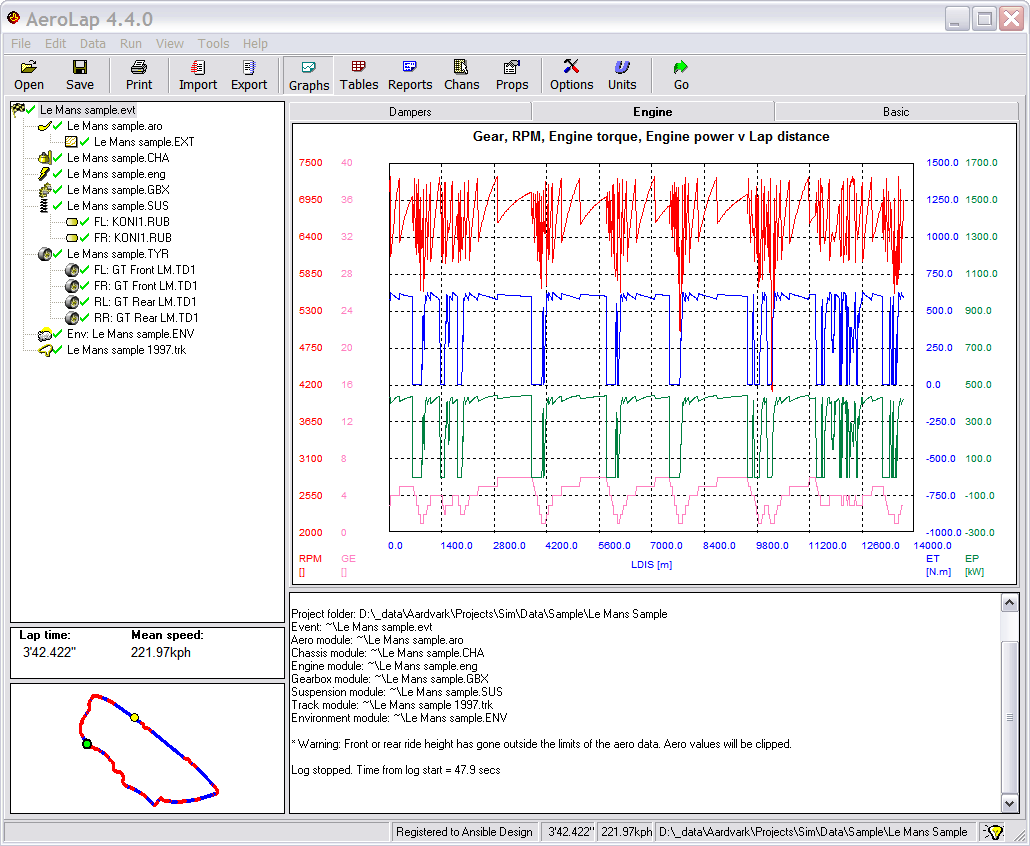
Graphs
After a simulation you can view the calculated
channels as you would view the data acquisition from the car on
the built-in Plot
display.
 Features include:
-
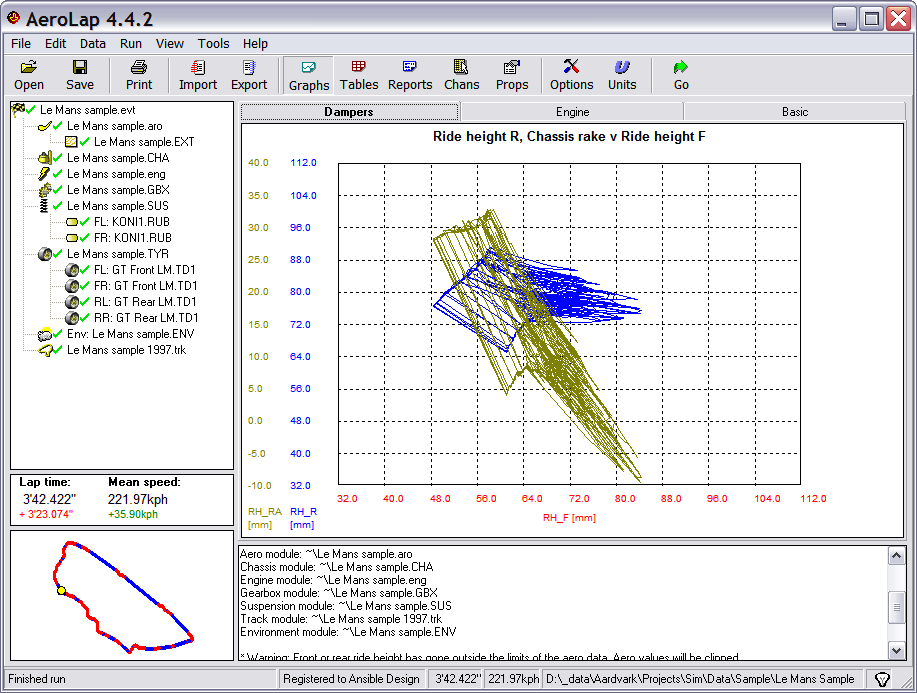
Graphs can be time- or distance-based, or scatter plots.
-
Multiple channels can be displayed
simultaneously.
-
Manual or auto-scaled channel display min/max values.
-
Manual or automatic choice of colours.
-
Multiple level zooming.
-
Traces can be overlaid on the results from
the last run.
-
Traces can be overlaid on data imported from
the car's data acquisition system - easy to
compare simulation with reality.
-
Live cursor read-out for displayed
channels.
-
Cursor position in data shown on track map.
There is always at least one Graph page, but you can add
extra pages, each with different formatting. Each page will be
redisplayed whenever you run a simulation.
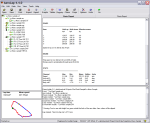
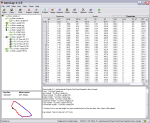
Circuit map
There is a circuit map with a current position cursor
indexed to the graph display, so you can see where on the
circuit the data belongs to.

|
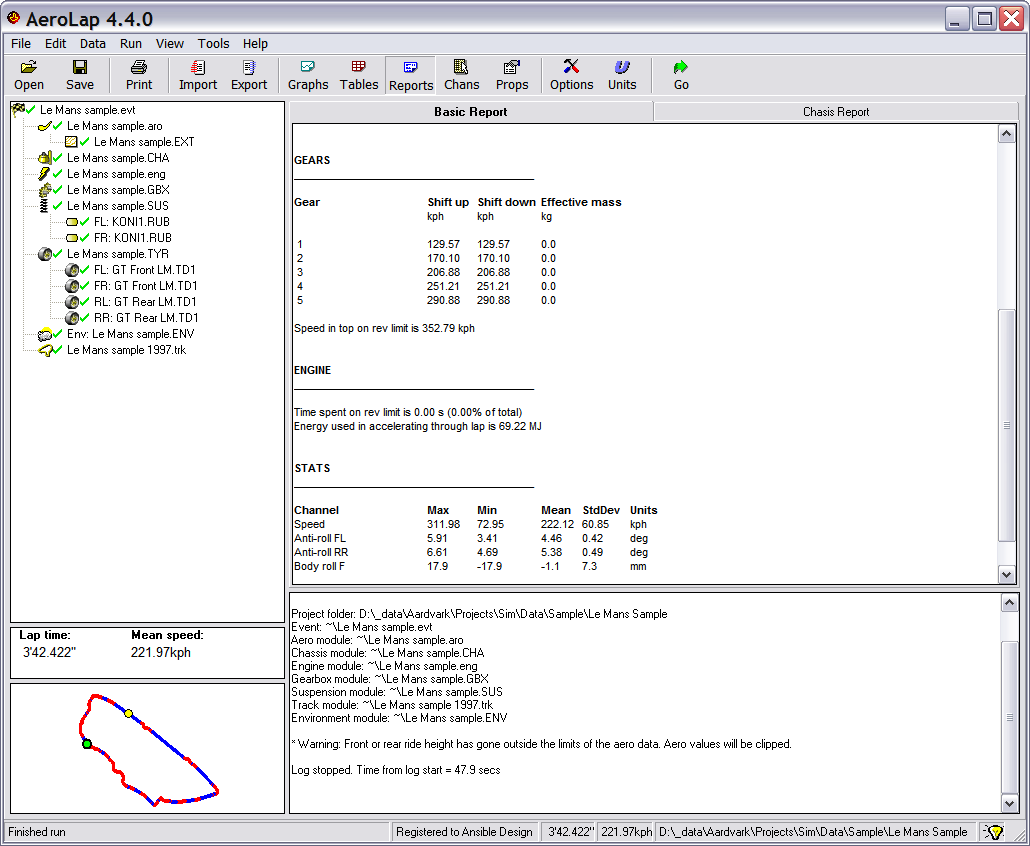
Reports
A pre-formatted text Report display with a summary analysis
of key properties from the simulated lap, including:
-
List of all files used for the simulation.
-
Lap time, average speed, start/finish line speed.
-
Time spent on the rev limiter.
-
Change speeds in gears.
-
Minimum, maximum, mean and standard deviation over the lap for
multiple user-chosen channels.
 There is always at least one Report page, but you can add
extra pages, each with different formatting. Each page will be
redisplayed whenever you run a simulation.
Tables
You can choose up to 40 channels to display in the Table
display. Each value is displayed at every point around the
track.
There is always at least one Table page, but you can add
extra pages, each with different formatting. Each page will be
redisplayed whenever you run a simulation.
Exports
You can export results in three ways for analysis in other
packages, such as spreadsheets:
-
Export the channels shown in the current display.
-
Export all channels manually.
-
Export all channels automatically at the end of each
run.
The export file format may be comma
separated text, which nearly all third party tools can handle,
or plain-text ASCII files suitable for importing into Pi Toolbox. |